Large Parks and Greenspace Community Needs Analysis in the Greater Toronto Area

Greenbelt Foundation

Greater Toronto Area

2021-2022

Green Infrastructure Ontario Coalition
Toronto and Region Conservation Authority
Continued growth across the Golden Horseshoe is increasing demand for greenspace, while access to large parks remains uneven across the region. Understanding where new parkland is needed requires looking beyond overall supply to how people access parks and where the greatest gaps exist.
In partnership with the Green Infrastructure Ontario Coalition and Toronto and Region Conservation Authority, Re:Public undertook a region-wide spatial analysis to identify and better understand these gaps. The study mapped more than 60,000 hectares of large parks and greenspaces, measured access by walking, cycling, transit, and driving, and combined these findings with demographic indicators to identify communities where the need for improved access is greatest.
The analysis also looked ahead, creating an inventory of planned large parks and comparing future park investment with projected population growth and existing accessibility gaps. Together, the work provided the spatial and statistical foundation for the Greenbelt Foundation’s broader research and policy work on large park access.
Mapping the Complete Network
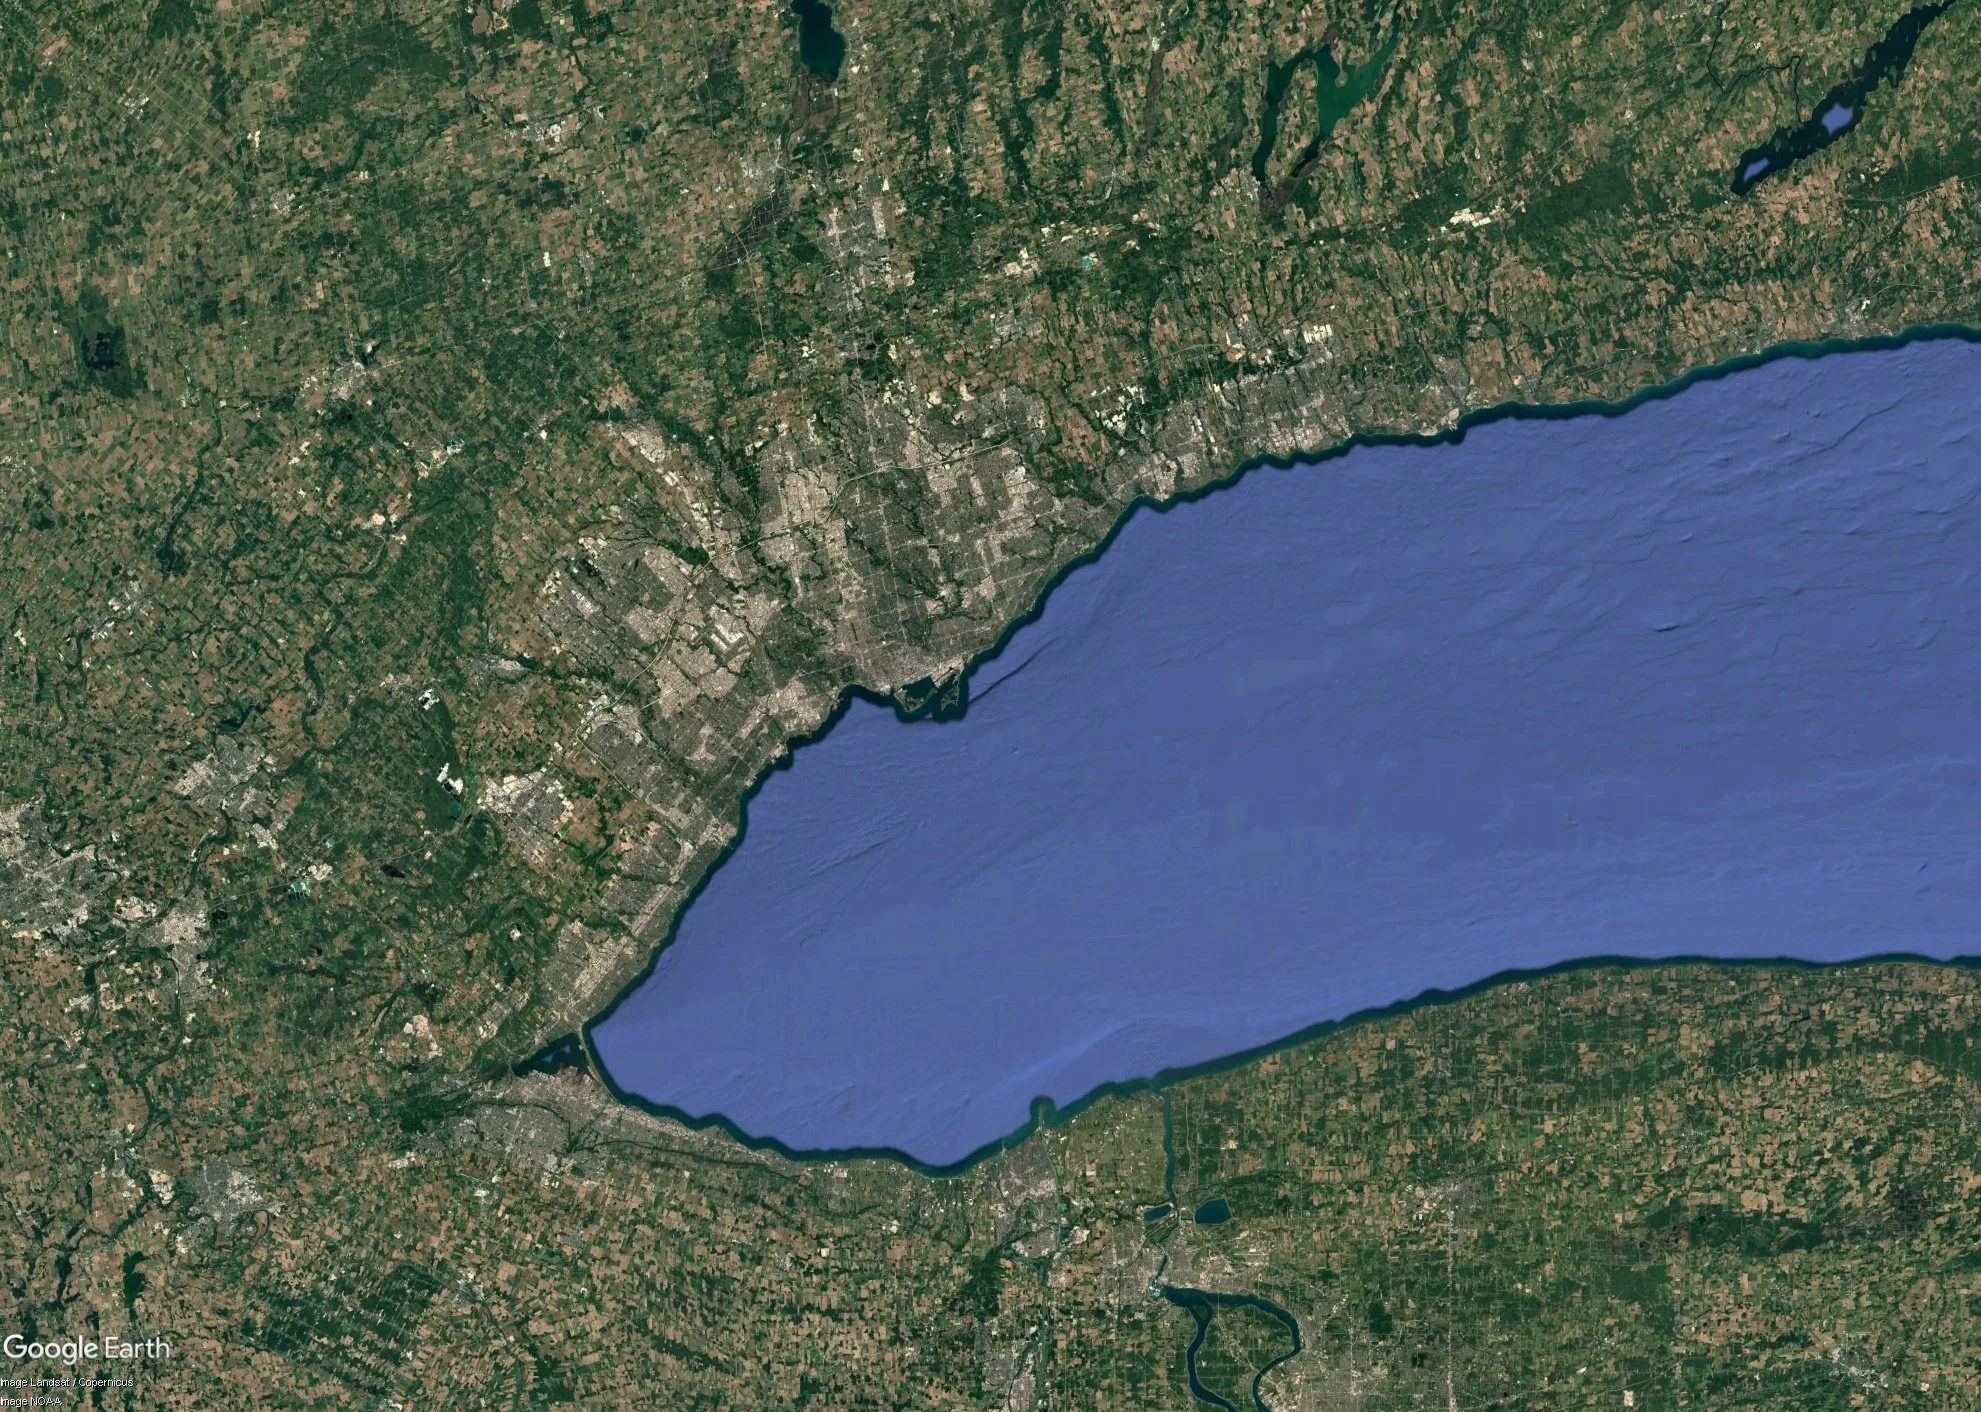
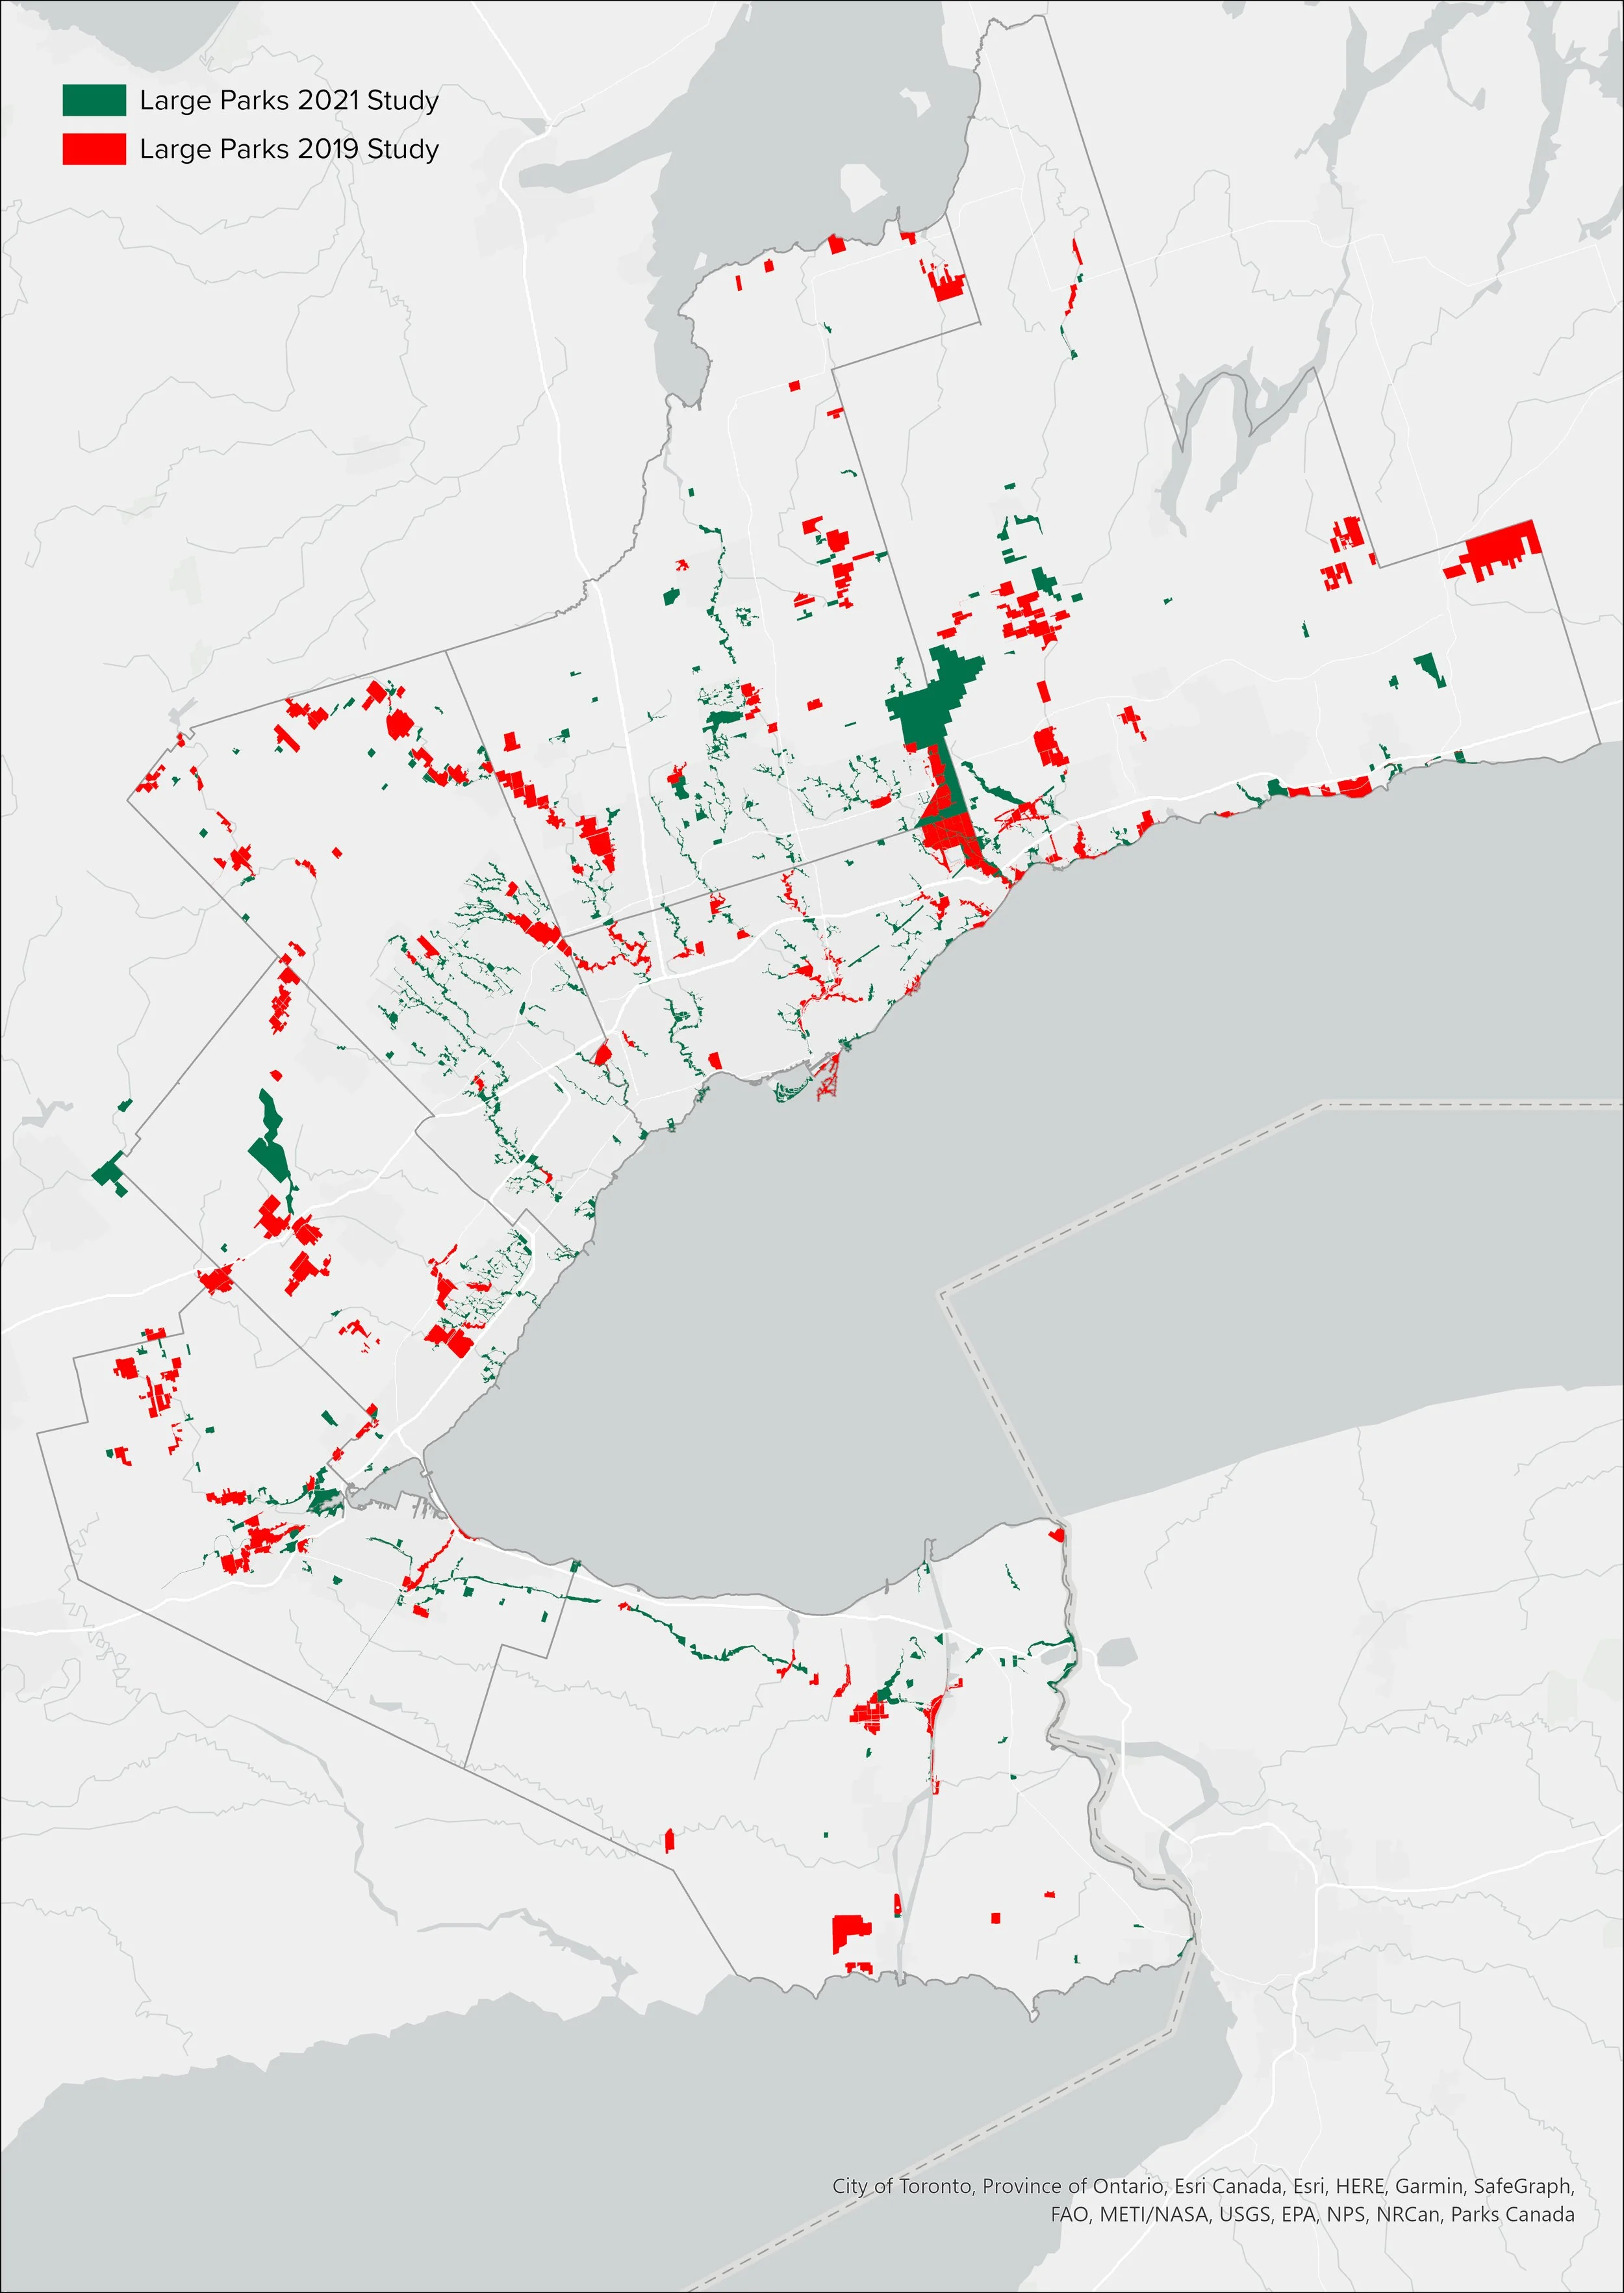
Rather than relying solely on municipal park boundaries and classifications, Re:Public developed a GIS methodology that considered size, vegetation, public access, and connections between adjacent greenspaces. NDVI satellite data helped distinguish naturalized landscapes from sports fields, paved areas, and other open spaces, while connected park areas separated by small roads or infrastructure were considered as part of a larger system.
The result was a more complete picture of the region’s naturalized park network: 354 large parks and greenspaces covering 60,631 hectares, compared with 139 parks identified through the earlier methodology.
Identifying Community Needs Areas
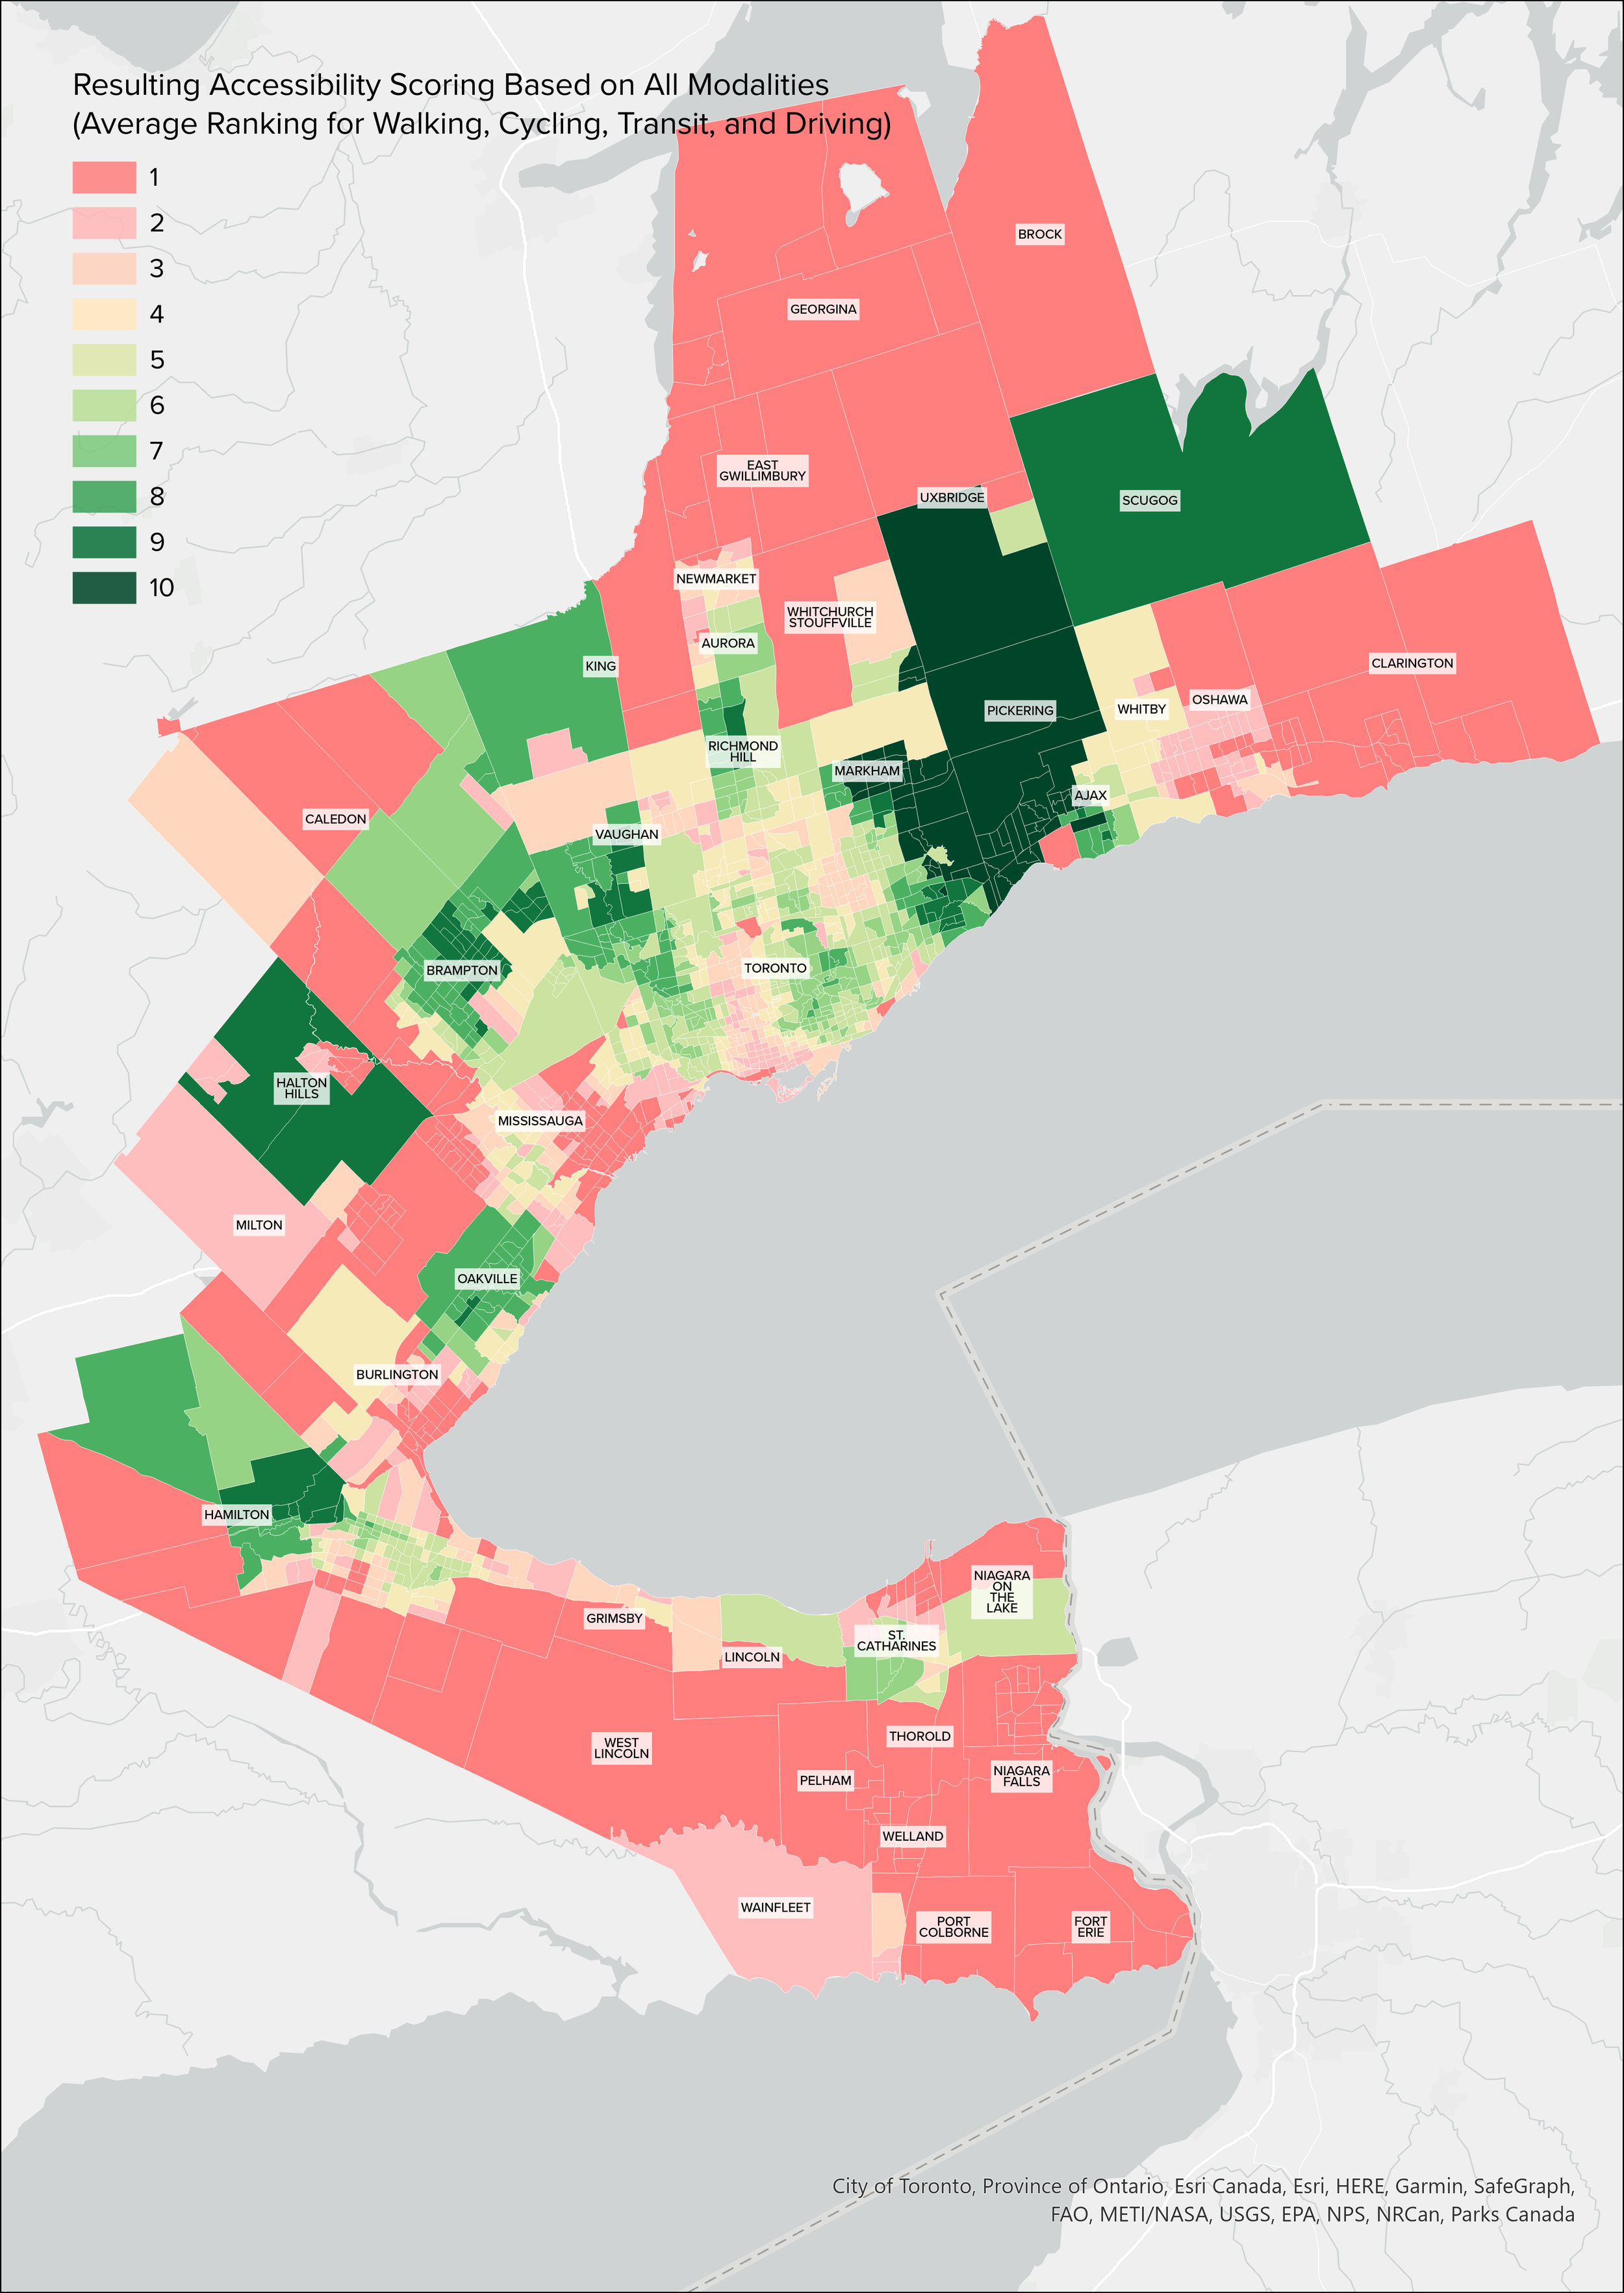
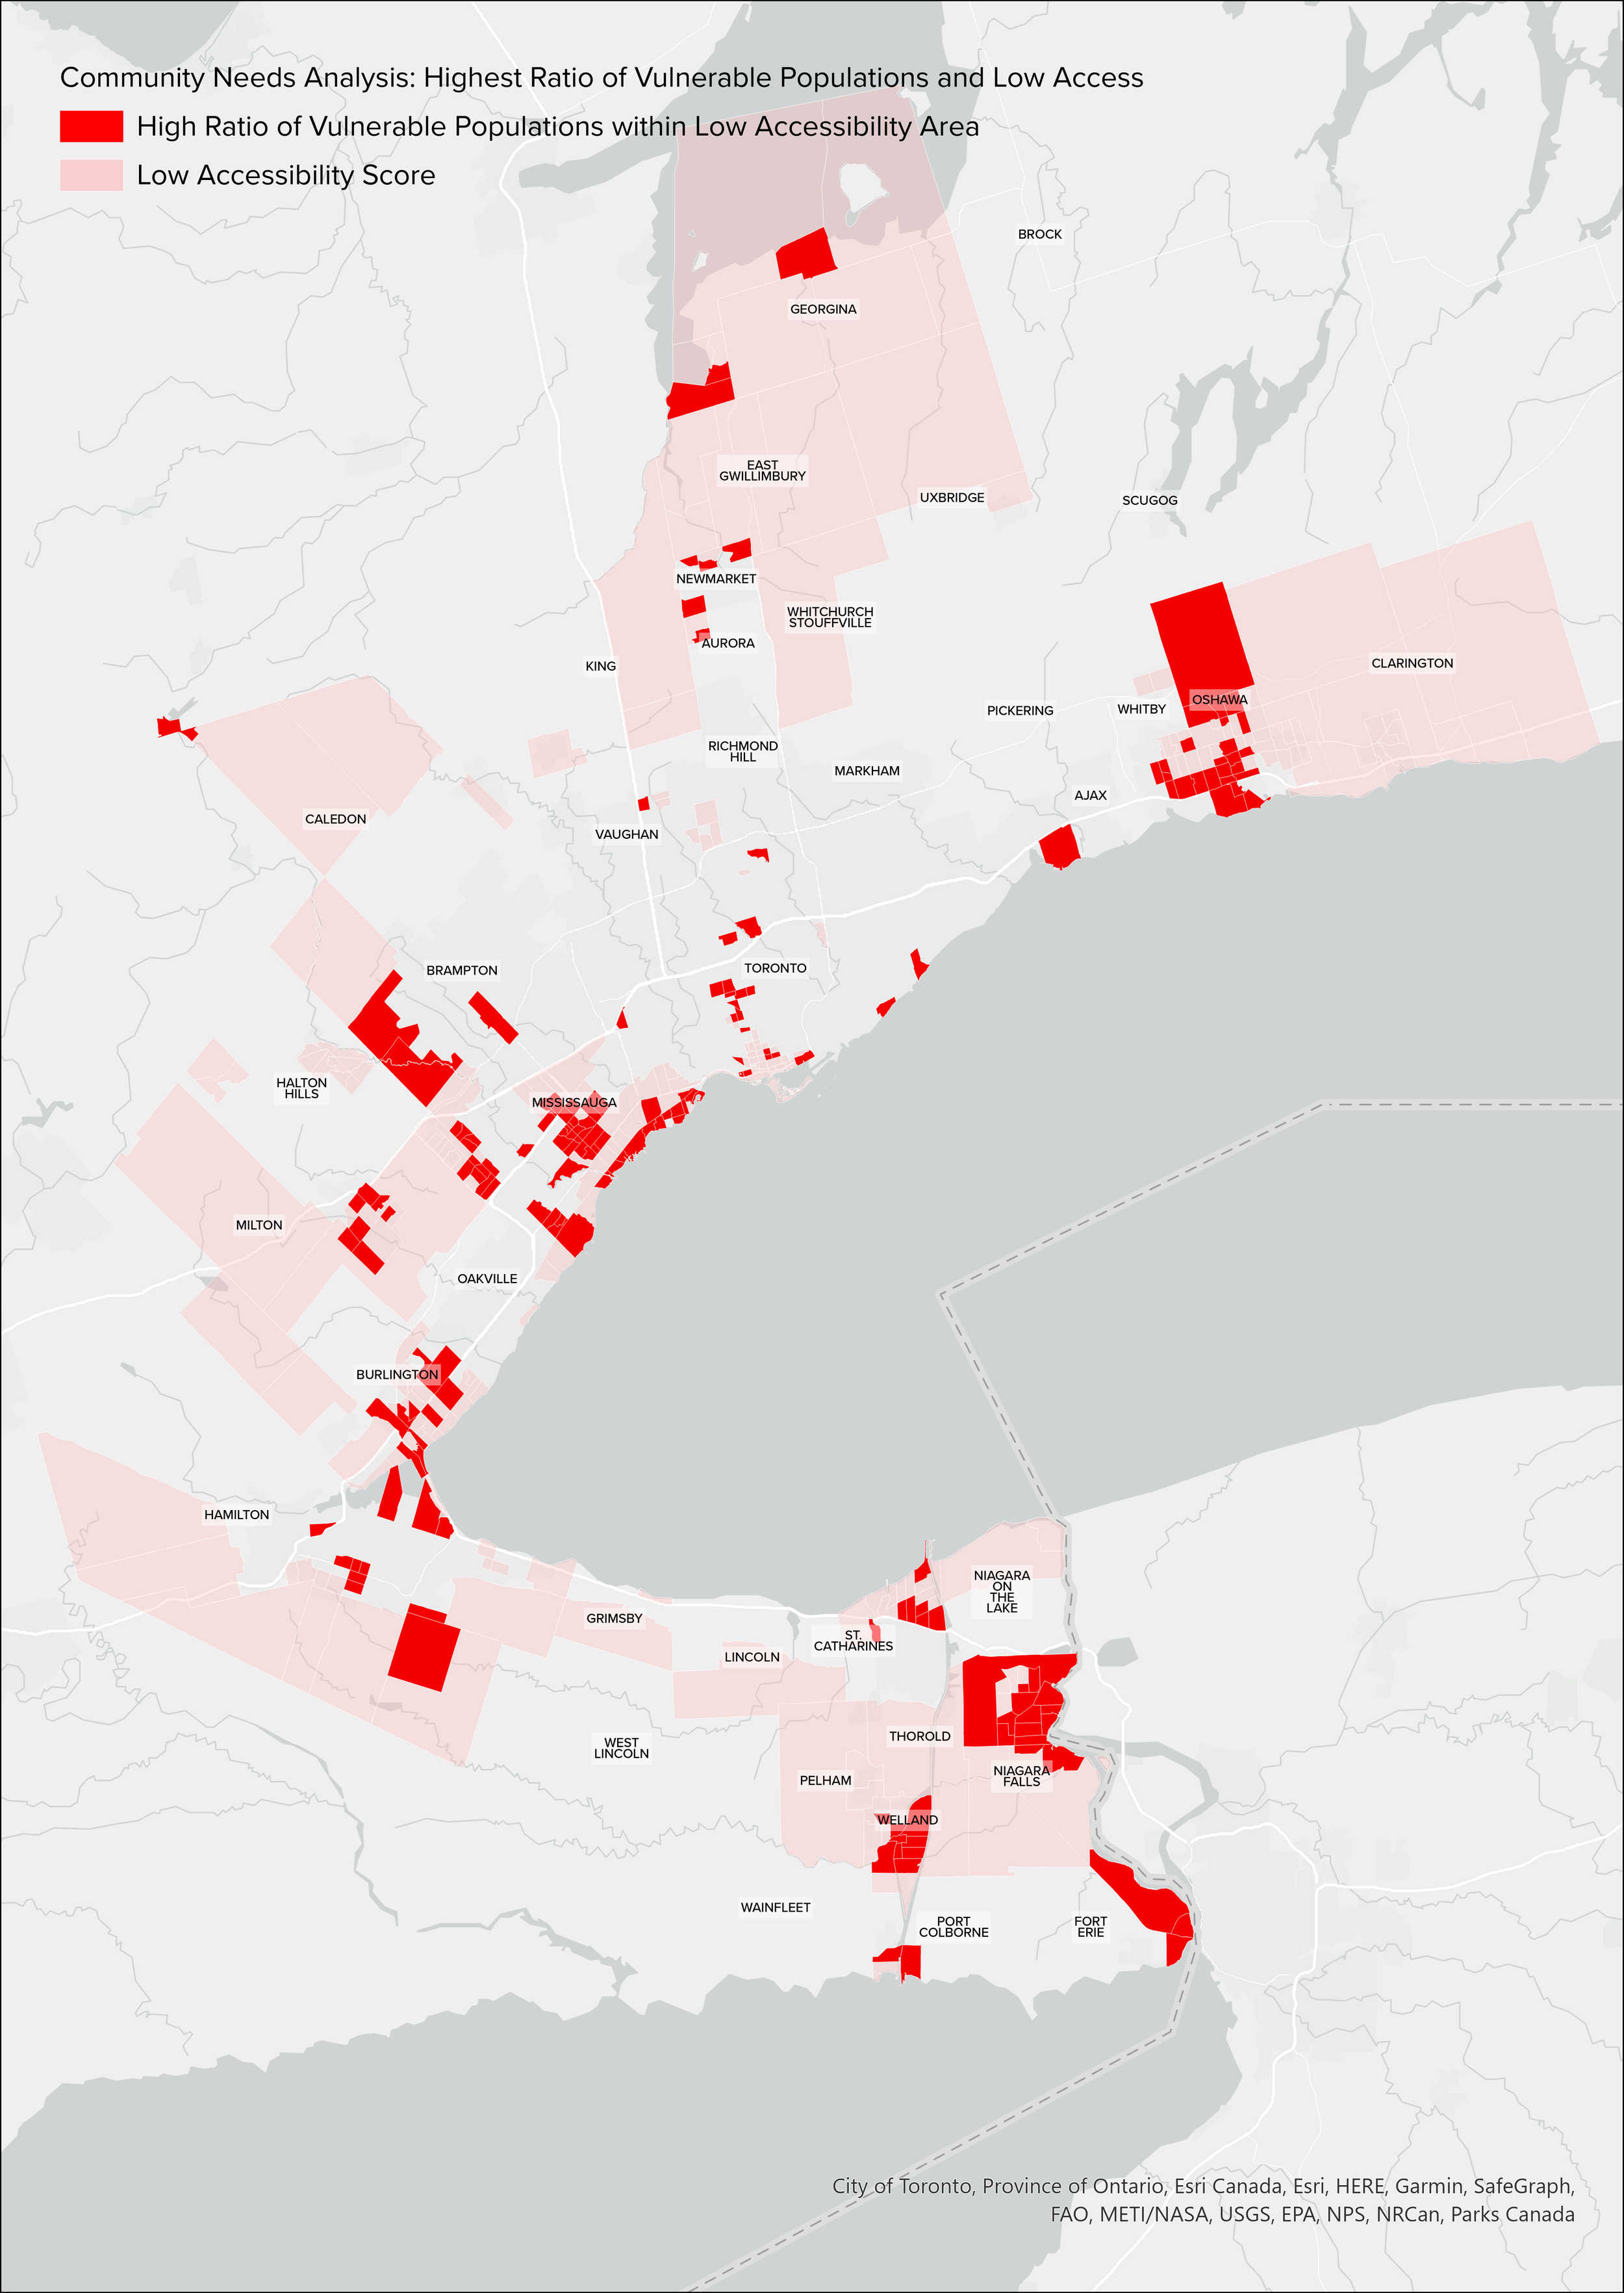
The study combined park access with census indicators to understand where limited access overlaps with communities that may face greater barriers to reaching greenspace.
The analysis found that 47% of neighbourhoods with high proportions of seniors and 55% of neighbourhoods with higher proportions of Indigenous residents had low access to large parkland. The resulting Community Needs mapping provided a spatial basis for considering equity alongside future park planning and investment.
Planning Parkland for Future Growth
With significant population growth expected across the Golden Horseshoe, the study also asked whether the future park system was keeping pace.
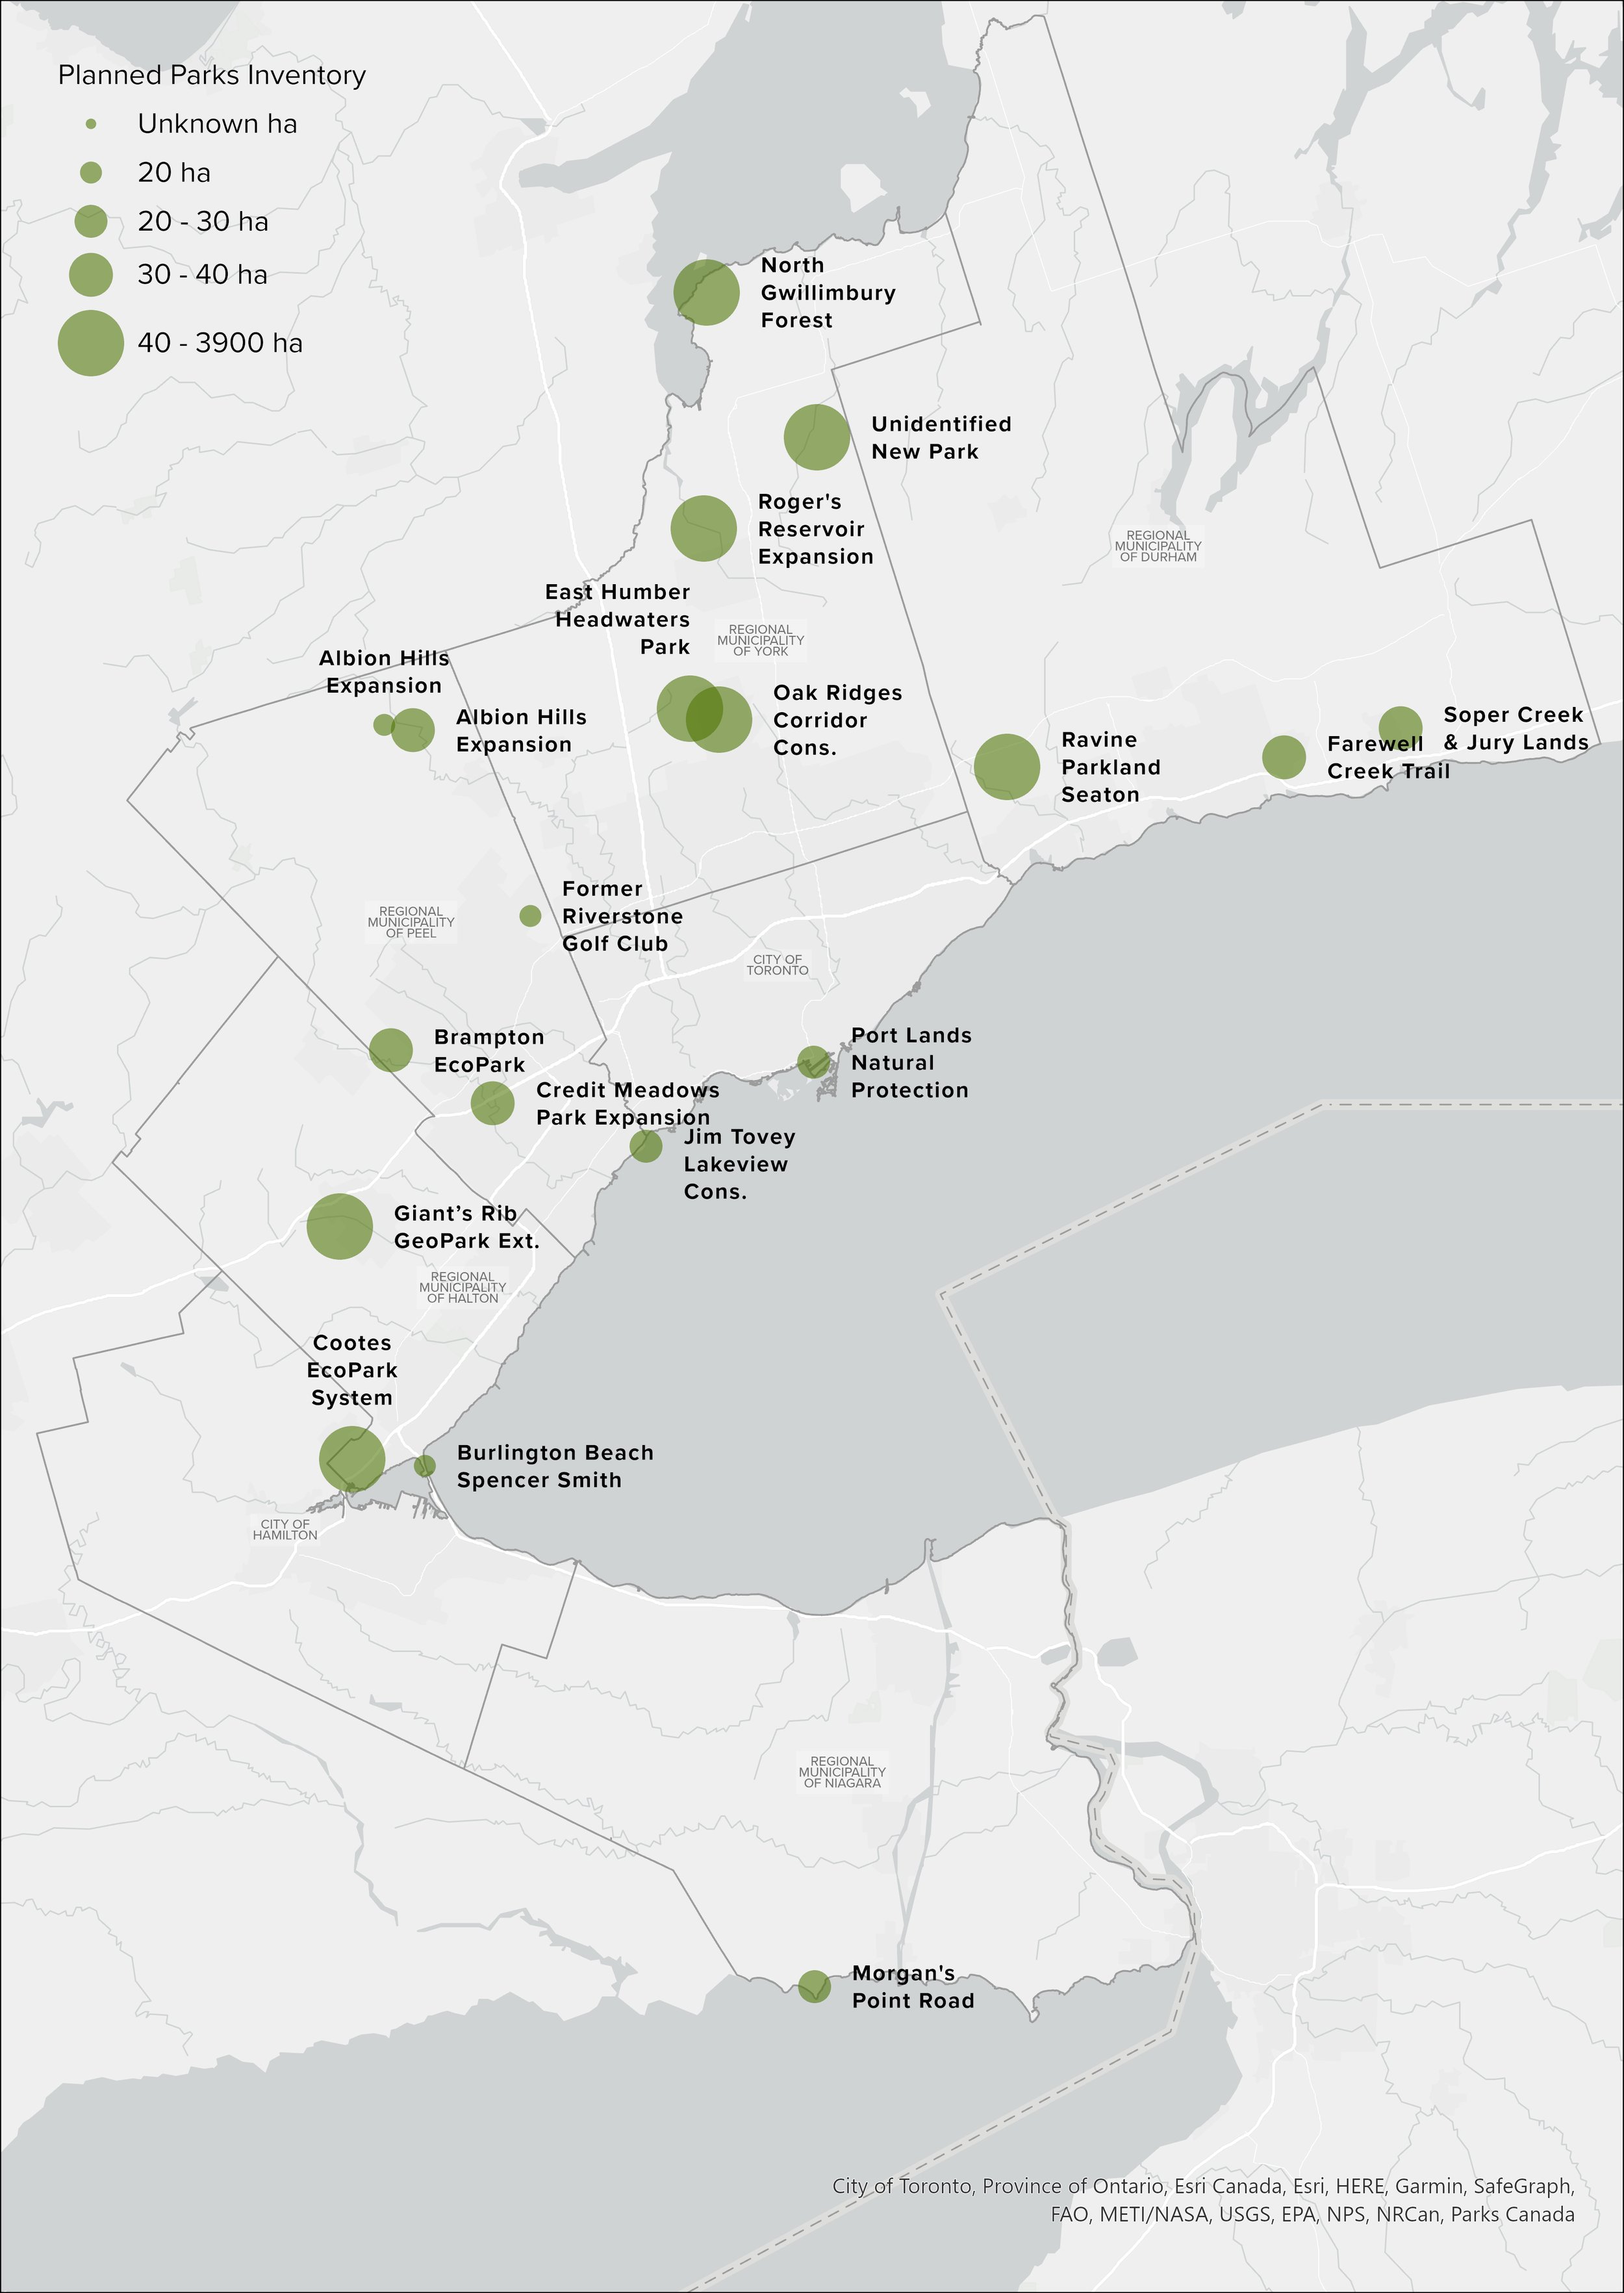
Re:Public inventoried large parks planned across municipal, conservation authority, and provincial plans and compared them against projected population growth and existing accessibility. While approximately 4,956 hectares of new large parkland were identified as planned, the analysis estimated that another 36,786 hectares would be required by 2051 simply to maintain 2021 rates of large parkland per capita.
By mapping planned investment alongside areas of existing need, the analysis provided a way to consider not only how much new greenspace is required, but where future parks could have the greatest impact.
Measuring What’s Within Reach
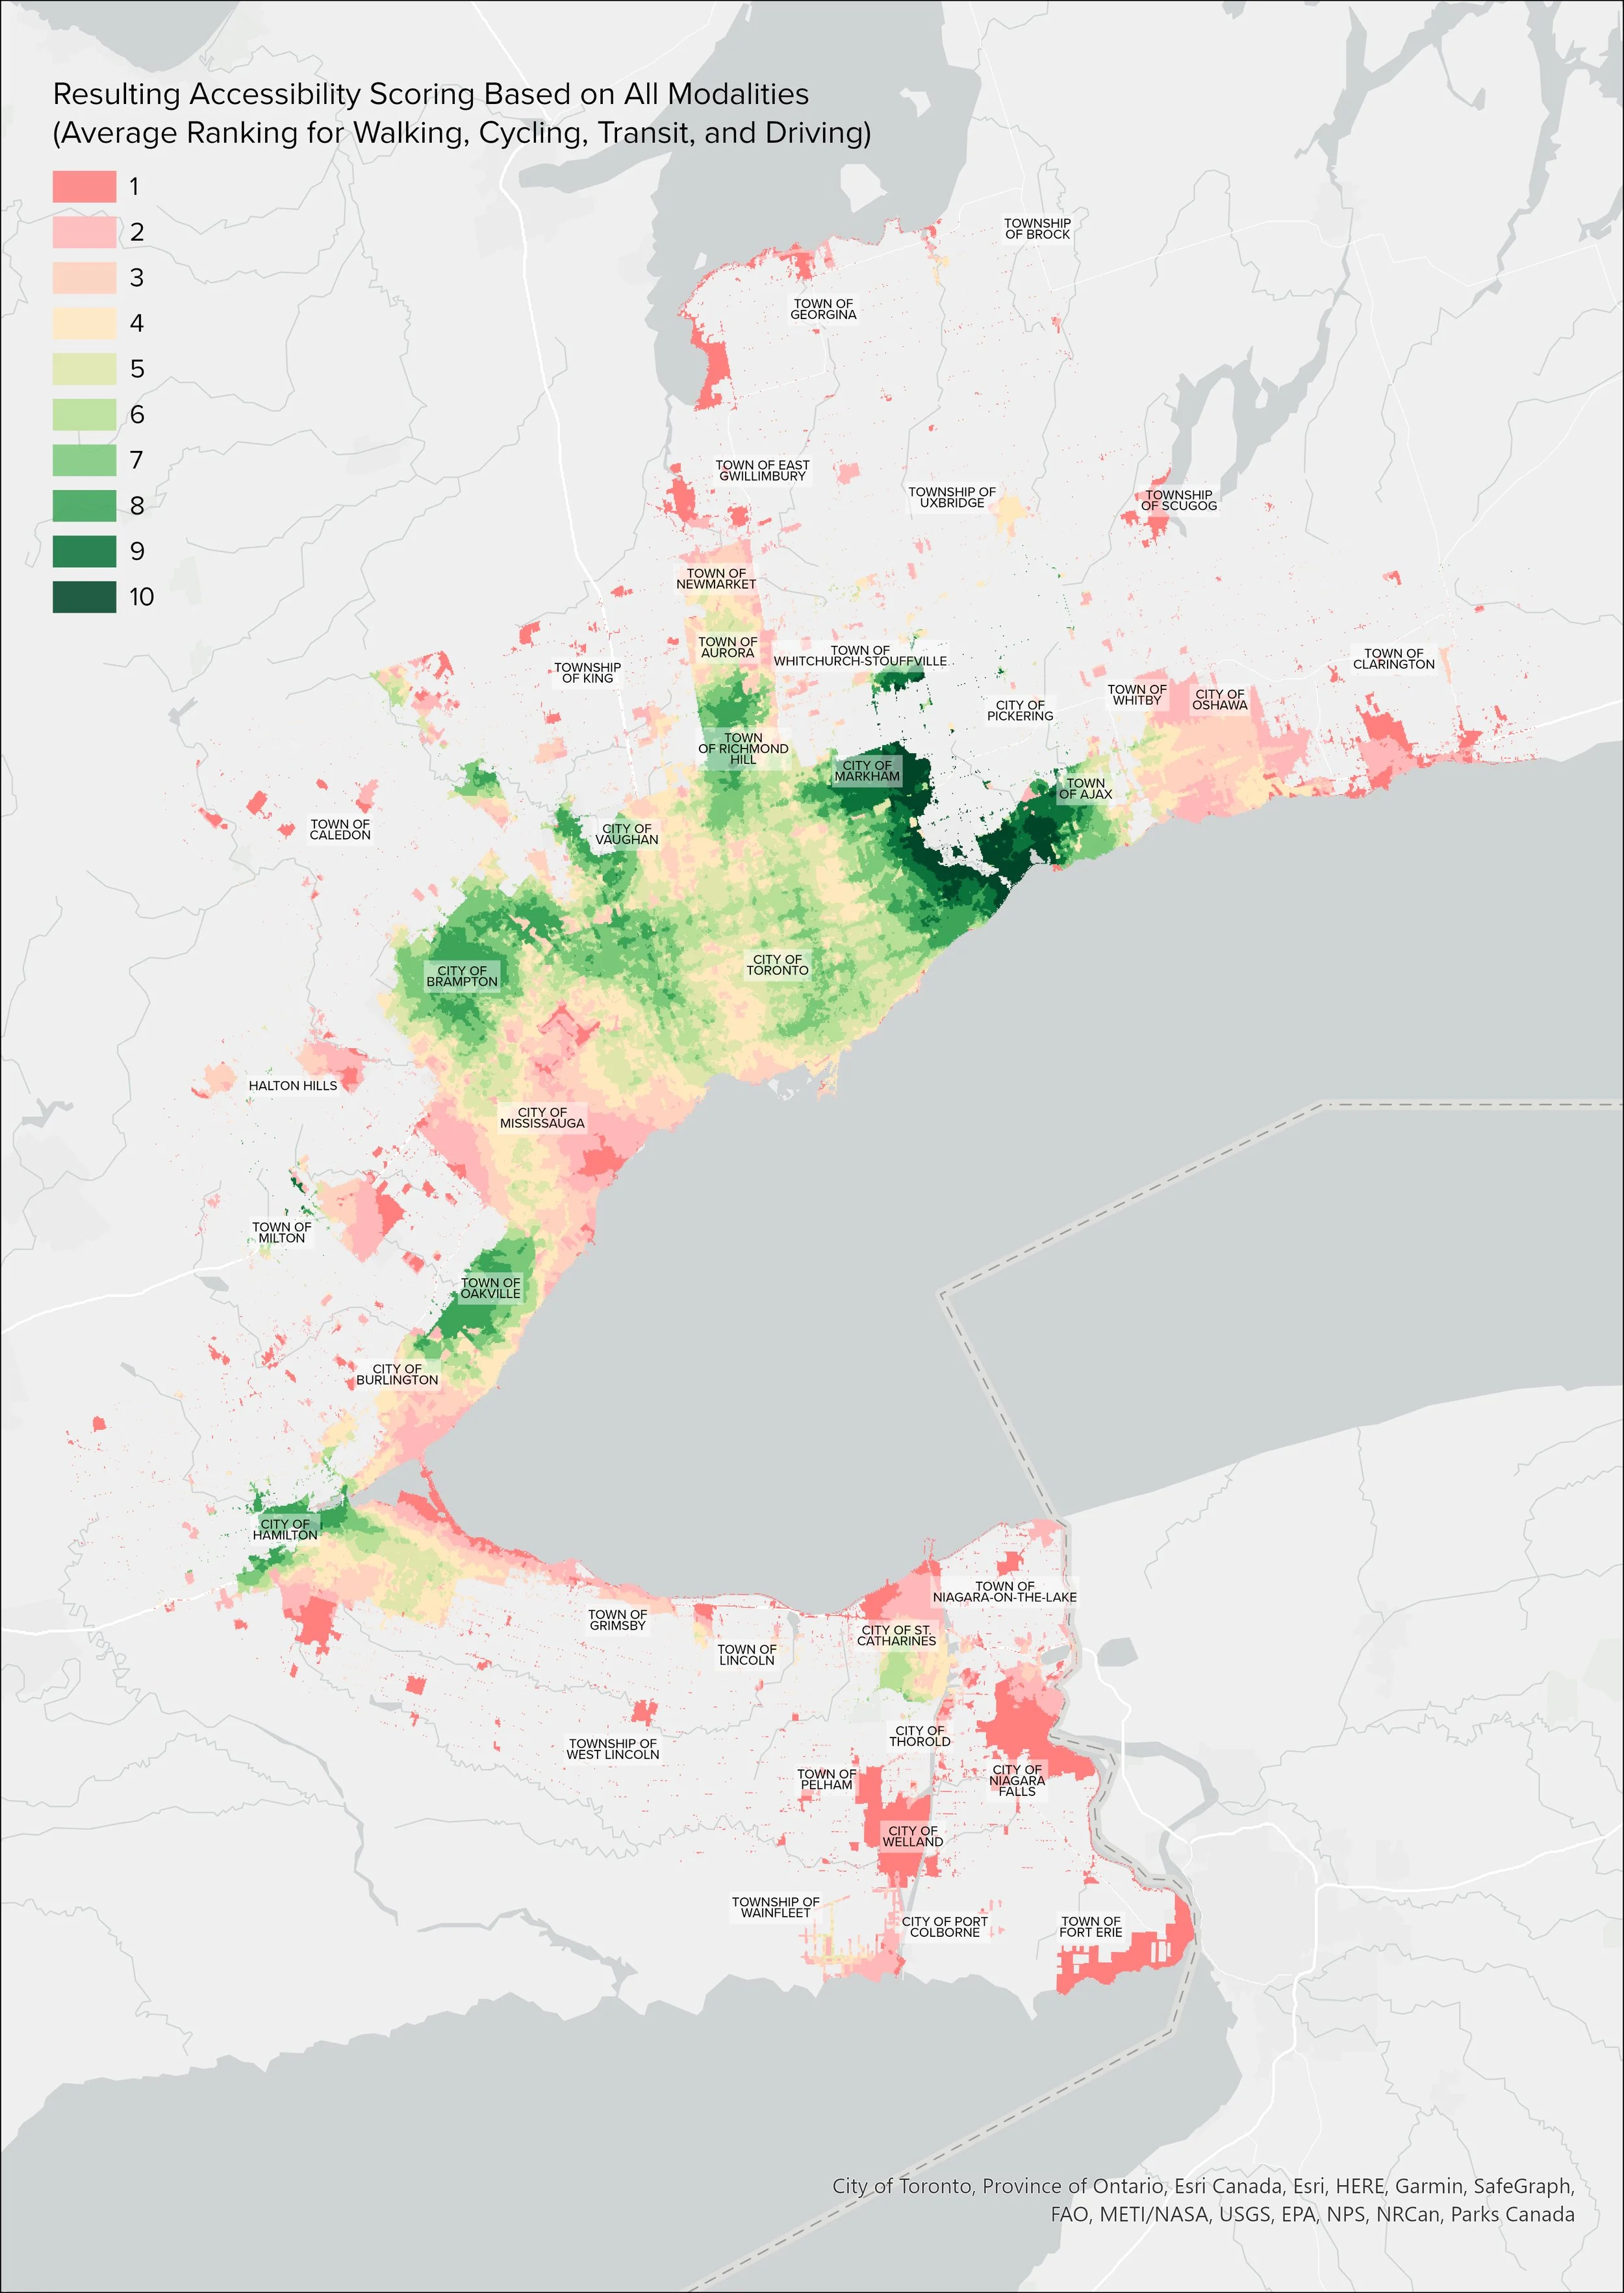
Re:Public developed a network-based accessibility model to measure how much large parkland could be reached from communities across the Golden Horseshoe by walking, cycling, public transit, and driving.
The analysis revealed substantial differences between park supply and park access. Some regions with relatively high amounts of parkland per capita also had some of the largest shares of residents living in low-access areas. Across the Golden Horseshoe, approximately 2.1 million people were living in neighbourhoods with the lowest overall accessibility to large parks.
Project Contact

Michelle Blom
Partner | Urban Design & GIS
blom@republicurbanism.com
Featured Projects
-
![]()
Cornwall Community Housing Development Plan
-
![]()
Port Hope Land Inventory
-
![]()
West Nipissing Land Use Strategy
-
![]()
Toronto Zoo Master Plan
-
![]()
Strathroy Downtown Master Plan
-
![]()
Sarnia Waterfront Master Plan